What is linear regression ?
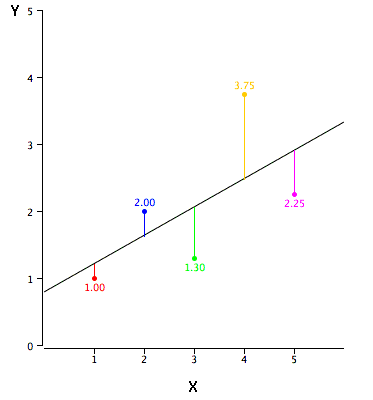
regression line is the best fitting straight line between the points. Gets closest to each point.
Talk is cheap, show me the code
Since we want to see our line, you are going to need canvas element with height and width of 400.
Lets start with simple point constructor:
Lets start with simple point constructor:
Then create our LinearRegression class definition with selector (<canvas> html element)
continue with init function, which selects our element, gets canvas context, and pushes coordinates of each click to the points array, the call draw() with each click
draw points when clicked using arc function, then use linreg function defined below and properties of its returned object in moveTo (beginning of drawing) and lineTo function, than draw the line using stroke()
then use our line function, to calculate y position for our line
linreg function, part 1, get avg position of all "x" and "y" points (their sum / points.length)
then subtract avg "x" point value from the current "x" point position
then subtract avg "x" point value from the current "x" point position
Get the gradient and by dividing a / b, then
Count intercept (place where line cuts y axis)
and return {gradient, intercept} object which is used in draw function
Count intercept (place where line cuts y axis)
and return {gradient, intercept} object which is used in draw function
Usage:
